AN IMMUNOMODULATOR WITH DEMONSTRATED EFFICACY1
COPAXONE® (glatiramer acetate injection) has a clinical profile demonstrated across 5 clinical trials.1 Select from the list of trials to view study data, or scroll down.

Khan 2013 GALA
A 12-month, double-blind, placebo-controlled, multinational study. Patients with RRMS were randomized to receive 3-times-a-week COPAXONE® 40 mg/mL (n=943) or placebo (n=461). The primary endpoint was total number of confirmed relapses.1,2
Placebo (n=461)
1.3 (0.6)
COPAXONE® 40 mg/mL (n=943)
1.3 (0.6)
Placebo (n=461)
17.4 mL (17.4)
COPAXONE® 40 mg/mL (n=943)
19.7 mL (20.7)
Placebo (n=461)
1.4 (3.7)
COPAXONE® 40 mg/mL (n=943)
1.7 (4.7)
3-times-a-week COPAXONE® 40 mg/mL significantly reduced relapses at 1 year.1,2

3-times-a-week COPAXONE® 40 mg/mL significantly reduced T1 lesions at 1 year.2
3-times-a-week COPAXONE® 40 mg/mL significantly reduced the number of new or enlarging T2 lesions at 1 year.2

Comi 2009 PreCISe
A 3-year, multicountry, multicenter, randomized, placebo-controlled, double-blind study in which 481 subjects with clinically isolated syndrome (CIS) were equally randomized into 2 parallel treatment groups: COPAXONE® 20 mg/mL (n=243) or matching placebo (n=238) administered once daily as a subcutaneous (SC) injection. The primary endpoint of the intent-to-treat analysis was time to conversion to clinically definite MS.1,3
Placebo (n=238)
1.6 (2.9)
COPAXONE® 20 mg/mL (n=243)
1.3 (2.8)
Placebo (n=238)
29.9 (26.3)
COPAXONE® 20 mg/mL (n=243)
33.0 (34.4)
In CIS, COPAXONE® significantly delayed time to second clinical event by more than a year (386 days).3
Secondary endpoint: 42.4% reduction in patients experiencing a second clinical event within 36 months among patients taking COPAXONE® compared to those taking placebo (24.7%, n=243 vs 42.9%, n=238, respectively; P<0.0001).1
In CIS, COPAXONE® significantly reduced new T2 lesions.3

Comi 2001
A double-blind, placebo-controlled study to determine the effect of COPAXONE® on the cumulative number of enhancing lesions found on monthly MRI in patients with RRMS (N=239; 119 COPAXONE®, 120 placebo) for 9 months. The primary outcome measure was the total number of enhancing lesions on T1-weighted images.1,4
Placebo (n=120)
4.4 (7.1)
COPAXONE® 20 mg/mL (n=119)
4.2 (4.8)
Placebo (n=120)
20.5 (18.8)
COPAXONE® 20 mg/mL (n=119)
20.0 (17.2)
In RRMS, COPAXONE® significantly reduced disease activity as measured by T1 GdE lesions.4

Johnson 1995
Double-blind, randomized, placebo-controlled, multicenter trial of glatiramer acetate in patients with RRMS (N=251; 125 COPAXONE®, 126 placebo).1,5
Placebo (n=126)
6.6 (5.1)
COPAXONE® 20 mg/mL (n=125)
7.3 (4.9)
Placebo (n=126)
2.4 (1.3)
COPAXONE® 20 mg/mL (n=125)
2.8 (1.2)
Placebo (n=126)
2.9 (1.1)
COPAXONE® 20 mg/mL (n=125)
2.9 (1.3)
In RRMS, COPAXONE® reduced relapses.1,5

Bornstein 1987
A 2-year, single-center, randomized study in which 50 subjects received daily doses of either COPAXONE® 20 mg/mL SC or placebo (COPAXONE®: n=25; placebo: n=25).1,6
Placebo (n=25)
6.1
COPAXONE® 20 mg/mL (n=25)
4.9
Placebo (n=25)
3.2
COPAXONE® 20 mg/mL (n=25)
2.9
Placebo (n=25)
3.9
COPAXONE® 20 mg/mL (n=25)
3.8
In RRMS, COPAXONE® significantly reduced relapses.6

Ford 2022: 27-Year Open-Label Extension
An open-label, randomized study in which all who entered received glatiramer acetate (GA). Participants were categorized by timing of GA treatment initiation for MS (N=208, early start: n=101, delayed start: n=107) and completion rates were tracked. All participants were randomized and categorized as follows:
- Entered the OLE:
- 208 out of 251 (82.9%)
- Completed the OLE:
- 24 out of 101 (23.8%, Early Start)
- 28 out of 107 (26.2%, Delayed Start up to 3 years)
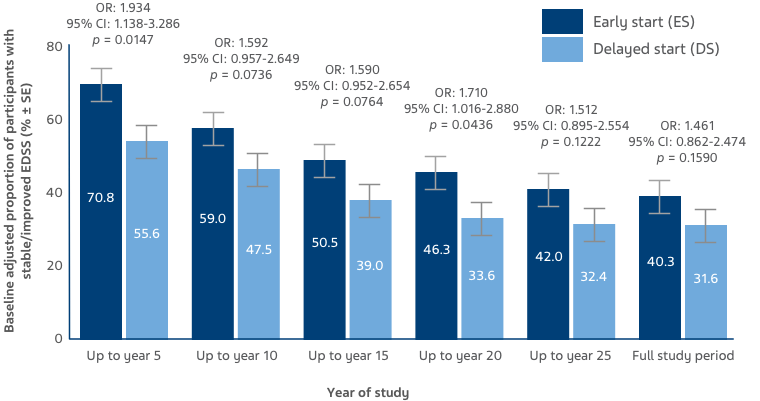
Baseline-adjusted proportion of participants with stable/improved EDSS was higher in the ES versus DS group, and remained numerically higher throughout the OLE (Figure 3).7

KEY: EDSS: Expanded Disability Status Scale; OR: odds ratio; CI: confidence interval
Figure 3: Stable/improved EDSS scores were defined as up to a 0.5-point increase from baseline, and worsened EDSS scores were defined as a >0.5 increase from baseline. Bars display percentage estimates ±SEs.7
Click on a link or scroll down to see the studies.

